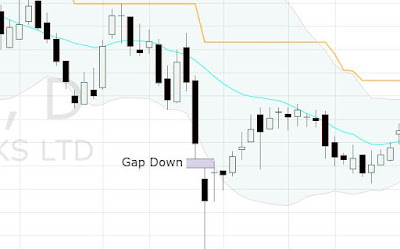
The gaps in the technical charts are formed when the price of the stock jumps up or down without the trading activity in between. So there could be two types of gaps in the chart.
Gap up:
Consider a stock which has made a high of 110 yesterday and closed at 105. The stock opened today at 130 and and made a low of 125. There is no trading activity at the prices 105 to 125. This gap is called as Gap-up.
 |
| Gap up in Jubilant Food Works on 16 Aug 2017 |
Gap Down:
Consider a stock which has made a low of 100 yesterday and closed at 105. The stock opened today at 80 and and made a high of 90. There is no trading activity at the prices 90 to 100. This gap is called as Gap-down.
 |
| Gap down in Jubilant Food Works on 30 May 2017 |
The gaps forms when the traders or investors placed the orders at before opening of the market and moved the stock price accordingly. The sentiments continues through out the day to keep the stock price at that level up or down from yesterday's high or low and the gap remains.
The gap ups are considered to be bullish and gap down are considered to be bearish. When the gap is formed along the trend the traders take a position along the trend. The investors uses the gap up position in the direction of upward trend along with the high volumes of delivery to know the further upward movement to invest in the stock.
(Note: The stocks mentioned here are for illustrations only and not recommendations.)
No comments:
Post a Comment